Showing posts with label statcast. Show all posts


Updated MLB Statcast Data (July 2015)

Thursday, October 29, 2015

0 comments

I am pretty sure by now we all know what Statcast is, have most likely seen it in use, and (for those of us who have been listening to the BttP Podcasts) are aware of its origins. Before the season, I compiled a database of all public MLB Statcast statistics and posted it here. Since then there has been a flurry of data released which warrants an update.
MLBAM is releasing a majority of its Statcast data the same way it released the PitchF/X data, through this pretty little website: http://gd2.mlb.com/components/game/mlb/. Most of this information on this site looks like mumbo-jumbo, but do not worry. There is another, more efficient and prettier website where you can download the data for free. It goes by the name BaseballSavant.comDarren Willman, creator of the Savant network of websites, has tapped into the MLBAM website and has graciously made all of this data easily accessible to everyone.
I took my own stab at integrating the xml files from the MLBAM website into my own database. While I was able to successfully connect to the portal and download the info, I ultimately found it much easier to just download the stats from Willmans’s website.


StatCast Playoff Data Breakdown

Friday, November 7, 2014

0 comments
Now that the baseball season is over I thought I would throw together a little data breakdown of the 2014 playoffs according to the public StatCast records available. I created a rough relational database that will allow me to run a few simple queries to give us an idea of what information the new system will be able to spit out on a daily basis (fingers crossed, next season). I built the database with the anticipation of adding to the records next year as more data is released. I hope, eventually, there will be complete statistics available for each play because in the current format there are many null values which drives me nuts, but it is what it is.

Seven tables make up the database that is designed to catch each play in it's entirety. The four main tables are BATTING, FIELDING, PITCHING, and RUNNING. This is where all of the new fancy data is stored. Now as to not get further into the weeds lets take a look at what we got.


A Compilation of Public MLB StatCast Statistics

Tuesday, August 12, 2014

0 comments
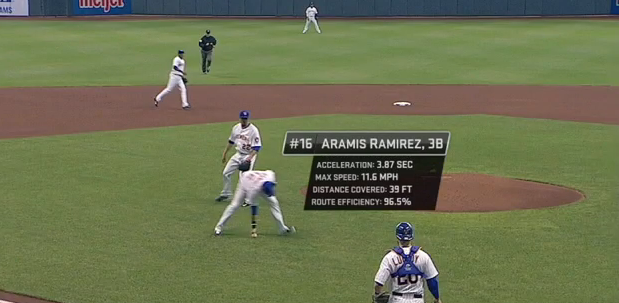
There has been a lot of hype about the new MLBAM StatCast system; a player tracking/raw data machine. With all of this new data will come a need for more data analysis and most likely a better way to store and track data. I have manually compiled every piece of StatCast data currently available to the public through the various videos published on MLB.com demonstrating some of the impressive capabilities of the new system.

Some of this data came from the 2014 All-Star Game since Major League Baseball was using that stage to show off StatCast. I assume we might see more examples released by MLB come playoff time. I have included below a maneuverable spreadsheet demonstrating a few of the key data fields that might be collected for each play in a major league baseball game using StatCast. The database that I created for this new StatCast data includes four tables connected to the Lahman database which I use to query players' past statistics. These four tables are PlayIndexB (Batters), PlayIndexF (Fielding), PlayIndexR (Base Running), PlayIndexP (Pitching). This seemed to me to be the easiest way to implement the new statistics since I can connect them to playerID's that would allow me to JOIN other tables in the Lahman files. These tables are meant to store every play within each game of a season using a playID to connect plays from table to table. For example, if I were to query playID 7062014003 it would bring up all the players and data involved with the third play of the game on 7-6-2014 whether it be on the Batters, Fielding, Running, or Pitching table. This setup will also allow me to use counting and rate SQL formulas to easily understand a players season and career StatCast statistics.

It is important to note that the tables I built contain many more data points for each play of a game and I will display those in a later post, but for now  I am only highlighting some flashy data in the spreadsheets.

As you look over the numbers you will see some stars like Mike Trout (troutmi01), Andrew McCutchen (mccutan01), and Troy Tulowitzki (tulowtr01). As I stated before, I was limited to the stats that have been released by MLB from a few 2013-2014 regular season games as well as the 2014 All-Star Game so the data on some of these players are incomplete or non-existent. This was more of a project about using the data we know can be tracked to create workable tables that can be fused with other different databases; in my case I am morphing the new data with the Lahman baseball files. While we have little data to work with now, in the future I will be ready to incorporate lots of play-by-play StatCast stats into my database.

I suggest that you browse each spreadsheet to get a feel for the data.....


Ok, now that you have played around with the spreadsheets you might be thinking of unique ways to use these numbers to help evaluate players. I have an ongoing brainstorming blog post that lists ways in which teams/management can use StatCast to test the overall performance of players.

Just for fun let's see who ranks highest in some of these new statistical categories based on the micro amount of data we have.

Batters
Greatest Exit Velocity (off bat): Jon Jay, 102.1 mph
Greatest Max Speed from H to 1B: Dee Gordon, 20.9 mph

Fielding
Quickest Acceleration: Andrew McCutchen, 3.54 ft/sec2
Greatest Max Speed: Billy Hamilton, 23.3 mph
Highest Route Efficiency: Andrew McCutchen, 99.7%
Quickest Release: Aramis Ramirez, .48 sec
Fastest Catchers Pop Time: Anthony Recker, .6 sec
Greatest Catchers Velocity: Anthony Recker, 78.8 mph

Base Running
Quickest First Step (on steal): Billy Hamilton, -.18 sec
Quickest Acceleration: Billy Hamilton, 2.17 ft/sec2
Greatest Max Speed: Billy Hamilton, 21.2 mph

Pitching
Longest Extension: Edison Volquez, 84 in
Actual Velocity: Edison Volquez, 95.2 mph
Largest Difference between Perceived and Actual Velocity: Francisco Rodriguez, 2.9 mph
Greatest Spin Rate: JJ Hoover, 2582 rpm

These stats really don't mean much since they're only taken from a few plays, but imagine what we could come up with if we had every games' stats. Also, think about how we could correlate some of this data with other metrics. How does a pitchers Spin Rate effect his Fly Ball or Ground Ball rate? How does a players Lead Length or First Step affect his Stolen Base percentage? Does a batters average Exit Velocity or Launch Angle have any correlation with his BABIP or OPS? This could help players know what they need to work on. A batter will now know if he needs to work on his acceleration out of the box and pitcher will know if his extension is causing him to throw more balls.

All of these things will be dealt with as soon as we get more data. I am trying to increase my "First Step" rate by creating tables to house the new data before it is available. In a future post I will hopefully come up with a good way to demonstrate all of the fields in my PlayIndex tables so that others can provide feedback. By no means do I think I have hit the nail on the head with this first attempt to store the new data, but I at least wanted to get the ball rolling.


Brainstorming MLBAM StatCast (Ongoing)

Monday, July 28, 2014

0 comments
Here are my thoughts on how teams could use the new MLBAM StatCast player tracking system to evaluate players performance. I have broke it down by a few broad baseball functions (Base running, Hitting, Fielding Infield, Fielding Outfield, and Pitching). I will update this post from time to time with new ideas.

Base runners
1. Top speed from home to first base, second base, and third base
2. Running path from home to first base, second base, and third base
3. Players top speed during a stolen base
4. Average length of a base runners lead
5. Players top speed from any base to any base
6. Players running path from any base to any base
7. Create a statistic for a players top average speed from each base to any base
8. Categorize base running stats by average top speed, average lead length
   i. Determine the correlation of avg top speed to stolen base pct and avg lead length to stolen base pct
   i. Determine correlation of avg top speed to extra base hits and running path to to extra base hits
9. Determine how many feet it takes for a player to reach top speed (Acceleration)
10. Determine optimum distance for a player to reach top speed while stealing a base 
11. Determine optimum distance for a player to reach top speed while running from one base/plate to another base. (Ex. Runner should reach top speed on a double when he is 50 feet away from 2nd base)
12. Determine optimum distance for a runner to begin their slide based on their average top speed, distance to reach top speed, and height of runner.
13. Determine which sliding path is most efficient (Ex. inside part of base, out side, straight)
14. Determine optimum base runner lead for a safe steal and slide back
15. Calculate a players average batted ball speed
   i. Correlation between avg batted ball speed and BA, SLG, OBP, extra base hits, HR, 1B, 2B, 3B
   i. Batted ball speed and the age of the player
16. Calculate a players average launch angle
   i. Correlation between a players avg launch angle and BA, SLG, OBP, extra base hits, HR, 1B, 2B,         3B (Can a player correct or improve his launch angle?)
17. Calculate a players average hang time of batted balls
   i. Correlation between a players hang time and BA, SLG, OBP, extra base hits, HR, 1B, 2B, 3B
18. Determine average first step of a base runner stealing a base
19. Determine average acceleration of a runner stealing a base

Hitting
1. Average batted ball distance
   i. Determine correlation from average batted ball distance and number of extra base hits, batting average, slugging pct, on base pct
   i. Determine average batted ball distance changes with the age of player
   i. Determine average batted ball distance for each MLB stadium
   i. Determine average batted ball distance for each stadium for each month (home and or away)

Fielding Infield
1. Most efficient place to stand when receiving a throw down from the catcher (be able to know the most used slide path of base runners)
2. Determine average route efficiency for each player
3. Percentage of balls fielded cleanly and thrown out (infield) (Ex. A player might have good range to get to the ground ball, but is he able to throw the runner out?)
4. Average distance a fielder travels to field ground ball cleanly (ex. compare good range with bad)
5. Calculate a players average first step time
6. Average catcher pop time
7. Average catcher arm strength in mph
8. Average infielders arm strength on throws to first
9. Average flight path of a catchers thrown ball (more to the left, right, or straight to 2nd base)
   i. Can throw down path demonstrate if a catcher is successful?

Fielding Outfield
1. Determine average route efficiency for each player
2. Average distance a fielder travels to field ball cleanly (ex. compare good range with bad)
3. Calculate a players average first step time
4. Calculate a players average top speed while fielding a line drive, fly ball, ground ball
5. Calculate a players average acceleration to the ball
6. Average arm strength on attempted assist throws.

Pitching
1. Determine correlation between a pitchers regular velocity and extension
2. Determine correlation between a pitchers perceived velocity and extension
3. Does spin rate determine where a ball might be hit?
4. Does spin rate correlate with the velocity of the ball?


ChyronHego and TrackMan™ Press Release About New StatCast Technology

Thursday, July 10, 2014

0 comments
The following press release was taken from ChyronHego.com.

MELVILLE, N.Y. — THURSDAY, APRIL 3, 2014
ChyronHego and TrackMan™, a leading provider of radar technology for sports, today announced a strategic partnership in baseball player and ball tracking technology. 
The combined best-of-breed solution is a non-invasive offering that provides quality data for player evaluation, coaching and fan experience analysis in a converged infrastructure. Teams can now develop customized analytics while maintaining their own unique process. 
“The ChyronHego and TrackMan partnership is a breakthrough in data gathering for the sport of baseball,” said Johan Apel, president and chief executive officer at ChyronHego. “Coaches are now able to analyze individual player movements and track the ball for every play and our real-time data provides fan experience executives with never before seen opportunities to engage fans in this uniquely data-driven sport.”
“The Big Data trends driven by cloud and mobility are creating a new style of sports analysis that is transforming what coaches and fans expect and need from sports technology,” said John Olshan, general manager at TrackMan Baseball. “I’m thrilled to have Trackman and ChyronHego work together to help the sport tackle these exciting challenges. By jointly developing and leveraging each other’s technology, we will deliver the highest standard in data performance and reliability. “  
ChyronHego and TrackMan will continue to develop and market the technology to a broad range of baseball teams and leagues around the globe. The combined solution has already been successfully deployed in multiple U.S. stadiums.