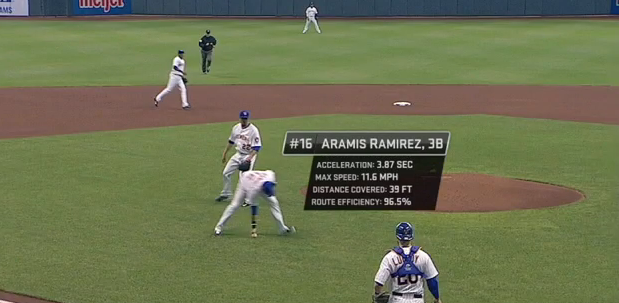
It is important to note that the tables I built contain many more data points for each play of a game and I will display those in a later post, but for now I am only highlighting some flashy data in the spreadsheets.
As you look over the numbers you will see some stars like Mike Trout (troutmi01), Andrew McCutchen (mccutan01), and Troy Tulowitzki (tulowtr01). As I stated before, I was limited to the stats that have been released by MLB from a few 2013-2014 regular season games as well as the 2014 All-Star Game so the data on some of these players are incomplete or non-existent. This was more of a project about using the data we know can be tracked to create workable tables that can be fused with other different databases; in my case I am morphing the new data with the Lahman baseball files. While we have little data to work with now, in the future I will be ready to incorporate lots of play-by-play StatCast stats into my database.
I suggest that you browse each spreadsheet to get a feel for the data.....
Ok, now that you have played around with the spreadsheets you might be thinking of unique ways to use these numbers to help evaluate players. I have an ongoing brainstorming blog post that lists ways in which teams/management can use StatCast to test the overall performance of players.
Just for fun let's see who ranks highest in some of these new statistical categories based on the micro amount of data we have.
Batters
Greatest Exit Velocity (off bat): Jon Jay, 102.1 mph
Greatest Max Speed from H to 1B: Dee Gordon, 20.9 mph
Fielding
Quickest Acceleration: Andrew McCutchen, 3.54 ft/sec2
Greatest Max Speed: Billy Hamilton, 23.3 mph
Highest Route Efficiency: Andrew McCutchen, 99.7%
Quickest Release: Aramis Ramirez, .48 sec
Fastest Catchers Pop Time: Anthony Recker, .6 sec
Greatest Catchers Velocity: Anthony Recker, 78.8 mph
Base Running
Quickest First Step (on steal): Billy Hamilton, -.18 sec
Quickest Acceleration: Billy Hamilton, 2.17 ft/sec2
Greatest Max Speed: Billy Hamilton, 21.2 mph
Pitching
Longest Extension: Edison Volquez, 84 in
Actual Velocity: Edison Volquez, 95.2 mph
Largest Difference between Perceived and Actual Velocity: Francisco Rodriguez, 2.9 mph
Greatest Spin Rate: JJ Hoover, 2582 rpm
These stats really don't mean much since they're only taken from a few plays, but imagine what we could come up with if we had every games' stats. Also, think about how we could correlate some of this data with other metrics. How does a pitchers Spin Rate effect his Fly Ball or Ground Ball rate? How does a players Lead Length or First Step affect his Stolen Base percentage? Does a batters average Exit Velocity or Launch Angle have any correlation with his BABIP or OPS? This could help players know what they need to work on. A batter will now know if he needs to work on his acceleration out of the box and pitcher will know if his extension is causing him to throw more balls.
All of these things will be dealt with as soon as we get more data. I am trying to increase my "First Step" rate by creating tables to house the new data before it is available. In a future post I will hopefully come up with a good way to demonstrate all of the fields in my PlayIndex tables so that others can provide feedback. By no means do I think I have hit the nail on the head with this first attempt to store the new data, but I at least wanted to get the ball rolling.


0 comments:
Post a Comment