This post goes along with a previous post in which I found that "...an All-Star selection can increase a player's salary significantly; on average by $1,517,550." Read the previous post here. What I did not demonstrate in the previous post, but intend to explain in this post is how that increase in a player's salary the year after an All-Star team selection relates to their statistical performance in that same year.
I used the same data that I compiled for the previous post, which included the list of All-Stars from 2002 - 2013 and their salaries before and after they were selected to the All-Star team, and added those same players core season statistics. For this post I am only going to deal with the batters, therefore I deleted the pitchers from my dataset as to not skew the calculations.
What I found was somewhat alarming, but not all that surprising. As I mentioned before, a player's salary increases by about $1.5 million on average the year after they are an All-Star. When I eliminated the pitchers from this list I found that batters ordinarily see an increase in annual salary of $1,426,104; a little less, but still a significant increase. As you look at the table, you will see that although teams tend to pay their batters more for making the All-Star team they do not necessarily see an increase or even a sustained level of production the following year from those players.
With that being said, in the grand scheme of things a drop off of an average of 18.1 Runs Created from one year to the next could be nothing more than simple regression. There will be years in which a player over performs for whatever reason. This does not mean the player is "overrated" or that he won't have another good year in the future. It simply means that if a player is a consistent .750 OPS guy and he has a year in which his OPS is .820 it's safe to say the next season he would be due to regress.
Also, I did not include age in my query of this dataset, but it should not be ruled out. If I'm not mistaken, with exception to perennial All-Stars (i.e. Jeter), players tend to make the All-Star team during their prime year(s) meaning 25-28 year old. As a whole, this slight drop off in production might be nothing more than age taking its toll.
So back to the question I posed in the previous post on whether an increase in a player's salary for making an All-Star game is justifiable for teams based on the future production of that player. At least with regards to the All-Star batters I would have to say no. Even though the overall average decrease in Runs Created was minimal, 18.1, it was still a decrease. I'm not saying don't reward the player at all, but it seems much more suitable in this case for teams to pay one time bonuses to players instead of increasing their annual salaries. Why pay a player a higher salary and ultimately shrink your payroll that much more for a guy who performed well for 90 games or so? This allows more risk to creep back into a team's decisions. I say, leave the salary raises for current players that prove they can consistently perform at a high level for multiple seasons or save the money for free agent acquisitions.
The way the system works right now, a player can take advantage of a half seasons worth of good games or even a strong marketing campaign to elevate their annual salary by $1.5 million. Teams that have to scrape every penny to obtain and keep good players should pay close attention to these kinds of findings so they are not poorly allocating scarce resources. Its Economics 101.
(SQL query of Lahman database using the Salaries, Batting, and AllStarFull followed by data manipulation in R studio)
Labels:
all star salary,
mlb all star,
runs created

Batters' Salaries After an All Star Year Compared to Their Production
Thursday, August 21, 2014
Labels:
all star salary,
mlb all star,
mlb salary
It Pays To Be An All-Star
Sunday, August 17, 2014
I am fascinated with MLB player salaries (all sports salaries for that matter), and I wanted to know if it was worth anything to the player to be selected to an All-Star team. I know players typically have incentives built into their contract for achievements such as this, but they usually fall under the category of a one time bonus. What about their actual salary? Is it affected if the player makes an All-Star team?

The Logic
To bring this question to light, I first compiled a list of every player that has been selected to an All-Star team from 2002 - 2013. I chose to use this time frame to keep the salaries at a somewhat comparable level to today's. Go back to far in history and player salaries are significantly lower. Once I had my list of players, I found the average player salary for each of those years as well as an average for all years combined. I then gathered those same players' salaries for the year after they were an All-Star. A quick subtraction formula gave me the difference for each players' salary before and after they were an All-Star. I calculated the mean of those values to understand if player salaries increase or decrease the year after an All-Star team selection and by how much.
The Numbers
The total average salary of pre-All-Star players from 2002-2013 was $6,811,333. The total average salary of those same players for the year after they were an All-Star was $8,436,326. That's a difference of +1,624,993. The average difference was calculated to be $1,517,550. Below is a bar chart breaking down the difference in player salaries from year to year.
It seems that an All-Star selection can increase a player's salary significantly; on average by $1,517,550. What does this mean for MLB players and teams? For players, it means do everything you can to get on the All-Star team. This includes those goofy campaign videos players use to gain publicity and in turn get votes.
Lucory's campaign video: http://m.mlb.com/video/topic/8879232/v33770085
For teams, a player achieving All-Star status seems to be a catch 22. Or is it? Of course the team wants all of their players to play like All-Stars, but it will cost them in elevated salaries if they actually make the team. I don't think this bothers clubs though. For one, I am guessing (since I do not have the hard data) that teams gain some cheap branding from a player's involvement in the All-Star game and two, the increase in the players production on the field elevates his market value which would most likely demand an increase in salary.
For a future post I might look deeper into the average increase (or decrease) in WAR or RC by a player who makes the All-Star game compared to their increase in salary. This will help teams realize whether an increase in a players salary in truly warranted. It would also help teams determine how much to increase a players salary if it was found to be a worth while investment.
Labels:
baseball database,
mlbam statcast,
stat cast
MLB StatCast Play Index Tables
Wednesday, August 13, 2014
So in a previous post, where I compiled all of the StatCast data available on players released by MLBAM video demos, I promised I would try to find a good way to display and explain the tables I built and how I incorporated those into the Lahman database.
The Lahman database uses a playerID as a key to connect a majority of the the tables. I kept this same playerID in the new tables that I constructed to house the play-by-play data gathered from StatCast. I chose to create four tables. One for the batting element of each play, one for the fielding element, one for base running, and one for pitching. All four tables are connected by a playID. I am defining a play to be anything other than your typical ball or strike calls, including foul balls out of play, where nothing is affected besides the count. Depending on the type of play that occurs during the game, there might be a playID referenced in all four tables. A minimum of two tables will be used on each play of a game.
Example 1: Pitcher throws a pitch to the batter. The batter hits a fly ball to the left fielder. The left fielder catches it for the first out of the inning. Everything that StatCast could record about that play would be stored within the Play Index tables. In this case, the data would be stored in all tables except for base running (PlayIndexR).
The playID is determined by the month, day and year of the game, along with the two teams playing (teamID) and the number of the play in that game.
Example: The tenth play of the game on August 14, 2014 where the Boston Red Sox are playing the New York Yankees.
08 14 2014 010 BOS NYA = 08142014010BOSNYA
D M Yr # Team Team
The playerID's allow for each play to be unique for every individual player involved. This in turn allows for us to count statistics for each player to use for other purposes like finding season total numbers. The playID connects each part of the play. Without the playID it would be more difficult to query a full play. However, without the playerID, you couldn't use counting or rate statistics to calculate things such as a players career average and totals from certain StatCast data.
As you look at the list some fields will be self explanatory and others will require more clarification. Remember, each table collects a specific players data that was involved in a play. Going back to the example from above. All of the StatCast information regarding the batter who hit the fly ball to the left fielder will be stored in the Batting Play Index table (PlayIndexB). For that same play, all of the data relating to the catch by the left fielder will be stored in the Fielding Play Index table (PlayIndexF) and the pitchers information will funnel into the Pitching Play Index table (PlayIndexP). Since there was no base runner, the Base running Play Index table contains nothing for that play. All of this data is unique to each player; the batter, left fielder, and pitcher. All of their data is, however, connected by the playID which remains the same.
Browse the spreadsheet and think of ways in which you could make this more functional. By no means is this a one-all. In a later post I will break down each field in more detail.
Labels:
history baseball pitchers,
infinite era,
unofficial era
The Forgotten Pitchers: Part 2 of 2
Tuesday, August 12, 2014
Our journey down the forgotten memory lane continues with the final twelve pitchers on our list of pitchers who have only one career appearance without recording a single out. Just to remind everyone, who did not read Part 1 of 2, these are not position players who happened to pitch one time. Some were starters, others relievers, but all of them where pitchers who had one game, zero innings pitched careers. In Part 2 we continue to learn about the men who almost left no mark on the game...almost.

12. Jim "Lefty" Scoggins (1913)
Just like most of these forgotten players, little is known about Jim "Lefty" Scoggins besides that he was born in Killeen, TX and he appeared in his one game on August 26, 1913 for the Chicago White Sox. The White Sox finished in the middle of the American League pack that year with a record of 78 -74. In his one glorious game, Jim faced 2 batters gave up 1 walk and 1 run.
Career Pitching for Jim Scoggins
23. Sam Mayer (1915)
Sam Mayer's career did not end in one game like that of his fellow pitchers on this list. Sam pitched in one game in the 1915 season for the Washington Senators. In that game he walked the first two batters he faced and was pulled before recording an out. The difference between Mayer and the other players on this list is that Sam's career extended for 22 more days. He played in the outfield for 11 games accruing 37 plate appearances, 7 hits and 1 dinger. However, it was his 1 game as a pitcher and short career that landed Sam Mayer on this list.
Career Pitching for Sam Mayer
Just like most of these forgotten players, little is known about Jim "Lefty" Scoggins besides that he was born in Killeen, TX and he appeared in his one game on August 26, 1913 for the Chicago White Sox. The White Sox finished in the middle of the American League pack that year with a record of 78 -74. In his one glorious game, Jim faced 2 batters gave up 1 walk and 1 run.
Career Pitching for Jim Scoggins
| IP | AB | R | ER | ERA | H | BB | WP | HBP |
|---|---|---|---|---|---|---|---|---|
| 0 | 2 | 1 | 0 | Inf | 0 | 1 | 0 | 0 |
13. Ed Coughlin (1884)
In a game against the Philadelphia Quakers on May 15, 1884, while playing for the Buffalo Bison of the National League, Ed Coughlin pitched in his one and only game as a major league baseball player. He pitched, or at least he tried to, to 5 batters. He gave up 3 hits and slung 2 wild pitches which led to 4 runs, 3 being earned. In that same game, Ed played a little outfield where he saw more success. He collected a hit and drove in a run so his career wasn't a total loss.
Career Pitching for Ed Coughlin
14. Pat McGehee (1912)
In 1912 the Boston Red Sox moved into the cathedral known as Fenway Park. That same year Boston won the World Series, beating the New York Giants four games to three. That same season on August 23rd Pat McGehee pitched against the Washington Senators as a member of the Detroit Tigers. His success was minimal. Although he allowed no runs, he gave up 1 hit and 1 walk in 2 at bats and left without recording an out.
Career Pitching for Pat McGehee
15. Bill Moore (1925)
Thirteen years after Pat McGehee pitched in his only game for the Tigers, a twenty three year old Bill Moore took his only trip to the mound as a big leaguer; also as member of the Detroit Tigers. In the second game of the 1925 season Bill faced 3 White Sox batters, walked all 3, allowing 2 earned runs.
Career Pitching for Bill Moore
16. Marty "Buddy" Walker (1928)
Buddy played in Philadelphia, where he was born and raised, for the Phillies organization and his career consisted of one game, in which he lost, and never recorded an out. The line below tells you all you need to know. Fun Fact: Babe Ruth hit 54 home runs that same year.
Career Pitching for Marty Walker
17. Joe Brown (1927)
Joe Brown made a career out of minor league baseball from 1924 to 1930 with one lonely call up to the Chicago White Sox on May 17, 1927. That day Brown faced 3 Red Sox batters allowing 3 runs on 2 hits and 1 base on balls. The Red Sox finished dead last that year in the American League with a record of 51 - 103.
Career Pitching for Joe Brown
18. John Wood (1896)
In the same year that Utah became a state and Negro League great Oscar Charleston was born, John Wood played in his only major league baseball game for the St. Louis Browns. In a game against the New York Giants on May 9, 1896, Wood pitched to 4 batters allowing 1 run on 1 hit, 2 walks, and 1 hit batsman. He left the game with 0 innings pitched. That year the Browns had a dismal season finishing second to last place in the National League with a 40-90 record right behind the Brooklyn Bridegrooms.
Career Pitching for John Wood
19. Sid Benton (1922)
Sid Benton's career pitching line might be the meekest of them all. On April 18, 1922, while pitching for the St. Louis Cardinals in St. Louis, Sid came into the game to face 2 Chicago Cubs batters and walked them both. Fun fact: Roger Hornsby, a teammate of Benton's on that '22 Cardinals team, won the triple crown that season with a .401 BA, 42 HR, and 152 RBI.
Career Pitching for Sid Benton
20. Art Gardiner (1923)
One year after Sid Benton's one game stint, Art Gardiner put up his own single game career. On September 25, 1923, Art pitched to 2 Pittsburgh Pirates batters as a member of the Philadelphia Phillies. He walked one and allowed a hit before being pulled for teammate Jim Bishop. The Pirates won the game 18-5.
Career Pitching for Art Gardiner
21. Jay Parker (1899)
Just before the turn of the century, Jay Parker made his only appearance in the majors at West Side Park against the Chicago Orphans on September 27, 1899. Jay pitched for the Pittsburgh Pirates and that day faced three batters allowing 2 walks and hitting a batter. An interesting fact about that 1899 season, the Pittsburgh Pirates finished the season with nearly identical records. The Orphans were 75-73 and the Pirates were 76-73.
Career Pitching for Jay Parker
22. Doc Sechrist (1899)
Five months before Jay Parker played in his only major league game and in the same season, Doc Sechrist pitched in his only game for the New York Giants. Against the Washington Senators on April 28, 1899 Doc saw 2 batters and walked both. He ended his career with no official ERA because he did not allow a run but never recorded an out. He played in the minors until 1904, but never made it back to the show.
Career Pitching for Doc Sechrist
Not to Be Left Out:
In a game against the Philadelphia Quakers on May 15, 1884, while playing for the Buffalo Bison of the National League, Ed Coughlin pitched in his one and only game as a major league baseball player. He pitched, or at least he tried to, to 5 batters. He gave up 3 hits and slung 2 wild pitches which led to 4 runs, 3 being earned. In that same game, Ed played a little outfield where he saw more success. He collected a hit and drove in a run so his career wasn't a total loss.
Career Pitching for Ed Coughlin
| IP | AB | R | ER | ERA | H | BB | WP | HBP |
|---|---|---|---|---|---|---|---|---|
| 0 | 5 | 4 | 3 | Inf | 3 | 0 | 2 | 0 |
14. Pat McGehee (1912)
In 1912 the Boston Red Sox moved into the cathedral known as Fenway Park. That same year Boston won the World Series, beating the New York Giants four games to three. That same season on August 23rd Pat McGehee pitched against the Washington Senators as a member of the Detroit Tigers. His success was minimal. Although he allowed no runs, he gave up 1 hit and 1 walk in 2 at bats and left without recording an out.
Career Pitching for Pat McGehee
| IP | AB | R | ER | ERA | H | BB | WP | HBP |
|---|---|---|---|---|---|---|---|---|
| 0 | 2 | 0 | 0 | 0 | 1 | 1 | 0 | 0 |
15. Bill Moore (1925)
Thirteen years after Pat McGehee pitched in his only game for the Tigers, a twenty three year old Bill Moore took his only trip to the mound as a big leaguer; also as member of the Detroit Tigers. In the second game of the 1925 season Bill faced 3 White Sox batters, walked all 3, allowing 2 earned runs.
Career Pitching for Bill Moore
| IP | AB | R | ER | ERA | H | BB | WP | HBP |
|---|---|---|---|---|---|---|---|---|
| 0 | 3 | 2 | 2 | Inf | 0 | 3 | 0 | 0 |
16. Marty "Buddy" Walker (1928)
Buddy played in Philadelphia, where he was born and raised, for the Phillies organization and his career consisted of one game, in which he lost, and never recorded an out. The line below tells you all you need to know. Fun Fact: Babe Ruth hit 54 home runs that same year.
Career Pitching for Marty Walker
| IP | AB | R | ER | ERA | H | BB | WP | HBP |
|---|---|---|---|---|---|---|---|---|
| 0 | 6 | 4 | 2 | Inf | 2 | 3 | 0 | 0 |
17. Joe Brown (1927)
Joe Brown made a career out of minor league baseball from 1924 to 1930 with one lonely call up to the Chicago White Sox on May 17, 1927. That day Brown faced 3 Red Sox batters allowing 3 runs on 2 hits and 1 base on balls. The Red Sox finished dead last that year in the American League with a record of 51 - 103.
Career Pitching for Joe Brown
| IP | AB | R | ER | ERA | H | BB | WP | HBP |
|---|---|---|---|---|---|---|---|---|
| 0 | 3 | 3 | 3 | Inf | 2 | 1 | 0 | 0 |
18. John Wood (1896)
In the same year that Utah became a state and Negro League great Oscar Charleston was born, John Wood played in his only major league baseball game for the St. Louis Browns. In a game against the New York Giants on May 9, 1896, Wood pitched to 4 batters allowing 1 run on 1 hit, 2 walks, and 1 hit batsman. He left the game with 0 innings pitched. That year the Browns had a dismal season finishing second to last place in the National League with a 40-90 record right behind the Brooklyn Bridegrooms.
| IP | AB | R | ER | ERA | H | BB | WP | HBP |
|---|---|---|---|---|---|---|---|---|
| 0 | 4 | 1 | 1 | Inf | 1 | 2 | 0 | 1 |
19. Sid Benton (1922)
Sid Benton's career pitching line might be the meekest of them all. On April 18, 1922, while pitching for the St. Louis Cardinals in St. Louis, Sid came into the game to face 2 Chicago Cubs batters and walked them both. Fun fact: Roger Hornsby, a teammate of Benton's on that '22 Cardinals team, won the triple crown that season with a .401 BA, 42 HR, and 152 RBI.
| IP | AB | R | ER | ERA | H | BB | WP | HBP |
|---|---|---|---|---|---|---|---|---|
| 0 | 2 | 0 | 0 | 0 | 0 | 2 | 0 | 0 |
20. Art Gardiner (1923)
One year after Sid Benton's one game stint, Art Gardiner put up his own single game career. On September 25, 1923, Art pitched to 2 Pittsburgh Pirates batters as a member of the Philadelphia Phillies. He walked one and allowed a hit before being pulled for teammate Jim Bishop. The Pirates won the game 18-5.
| IP | AB | R | ER | ERA | H | BB | WP | HBP |
|---|---|---|---|---|---|---|---|---|
| 0 | 2 | 0 | 0 | 0 | 1 | 1 | 0 | 0 |
21. Jay Parker (1899)
Just before the turn of the century, Jay Parker made his only appearance in the majors at West Side Park against the Chicago Orphans on September 27, 1899. Jay pitched for the Pittsburgh Pirates and that day faced three batters allowing 2 walks and hitting a batter. An interesting fact about that 1899 season, the Pittsburgh Pirates finished the season with nearly identical records. The Orphans were 75-73 and the Pirates were 76-73.
| IP | AB | R | ER | ERA | H | BB | WP | HBP |
|---|---|---|---|---|---|---|---|---|
| 0 | 3 | 2 | 2 | Inf | 0 | 2 | 0 | 1 |
22. Doc Sechrist (1899)
Five months before Jay Parker played in his only major league game and in the same season, Doc Sechrist pitched in his only game for the New York Giants. Against the Washington Senators on April 28, 1899 Doc saw 2 batters and walked both. He ended his career with no official ERA because he did not allow a run but never recorded an out. He played in the minors until 1904, but never made it back to the show.
| IP | AB | R | ER | ERA | H | BB | WP | HBP |
|---|---|---|---|---|---|---|---|---|
| 0 | 2 | 0 | 0 | 0 | 0 | 2 | 0 | 0 |
Not to Be Left Out:
23. Sam Mayer (1915)
Sam Mayer's career did not end in one game like that of his fellow pitchers on this list. Sam pitched in one game in the 1915 season for the Washington Senators. In that game he walked the first two batters he faced and was pulled before recording an out. The difference between Mayer and the other players on this list is that Sam's career extended for 22 more days. He played in the outfield for 11 games accruing 37 plate appearances, 7 hits and 1 dinger. However, it was his 1 game as a pitcher and short career that landed Sam Mayer on this list.
| IP | AB | R | ER | ERA | H | BB | WP | HBP |
|---|---|---|---|---|---|---|---|---|
| 0 | 2 | 0 | 0 | 0 | 0 | 2 | 0 | 0 |
(Statistics derived from a SQL query of the Lahman Baseball Database)
Labels:
statcast,
statcast database,
statcast play index
A Compilation of Public MLB StatCast Statistics
There has been a lot of hype about the new MLBAM StatCast system; a player tracking/raw data machine. With all of this new data will come a need for more data analysis and most likely a better way to store and track data. I have manually compiled every piece of StatCast data currently available to the public through the various videos published on MLB.com demonstrating some of the impressive capabilities of the new system.
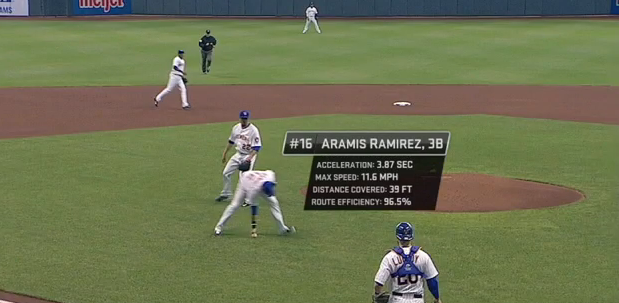
Some of this data came from the 2014 All-Star Game since Major League Baseball was using that stage to show off StatCast. I assume we might see more examples released by MLB come playoff time. I have included below a maneuverable spreadsheet demonstrating a few of the key data fields that might be collected for each play in a major league baseball game using StatCast. The database that I created for this new StatCast data includes four tables connected to the Lahman database which I use to query players' past statistics. These four tables are PlayIndexB (Batters), PlayIndexF (Fielding), PlayIndexR (Base Running), PlayIndexP (Pitching). This seemed to me to be the easiest way to implement the new statistics since I can connect them to playerID's that would allow me to JOIN other tables in the Lahman files. These tables are meant to store every play within each game of a season using a playID to connect plays from table to table. For example, if I were to query playID 7062014003 it would bring up all the players and data involved with the third play of the game on 7-6-2014 whether it be on the Batters, Fielding, Running, or Pitching table. This setup will also allow me to use counting and rate SQL formulas to easily understand a players season and career StatCast statistics.
It is important to note that the tables I built contain many more data points for each play of a game and I will display those in a later post, but for now I am only highlighting some flashy data in the spreadsheets.
As you look over the numbers you will see some stars like Mike Trout (troutmi01), Andrew McCutchen (mccutan01), and Troy Tulowitzki (tulowtr01). As I stated before, I was limited to the stats that have been released by MLB from a few 2013-2014 regular season games as well as the 2014 All-Star Game so the data on some of these players are incomplete or non-existent. This was more of a project about using the data we know can be tracked to create workable tables that can be fused with other different databases; in my case I am morphing the new data with the Lahman baseball files. While we have little data to work with now, in the future I will be ready to incorporate lots of play-by-play StatCast stats into my database.
I suggest that you browse each spreadsheet to get a feel for the data.....
Ok, now that you have played around with the spreadsheets you might be thinking of unique ways to use these numbers to help evaluate players. I have an ongoing brainstorming blog post that lists ways in which teams/management can use StatCast to test the overall performance of players.
Just for fun let's see who ranks highest in some of these new statistical categories based on the micro amount of data we have.
Batters
Greatest Exit Velocity (off bat): Jon Jay, 102.1 mph
Greatest Max Speed from H to 1B: Dee Gordon, 20.9 mph
Fielding
Quickest Acceleration: Andrew McCutchen, 3.54 ft/sec2
Greatest Max Speed: Billy Hamilton, 23.3 mph
Highest Route Efficiency: Andrew McCutchen, 99.7%
Quickest Release: Aramis Ramirez, .48 sec
Fastest Catchers Pop Time: Anthony Recker, .6 sec
Greatest Catchers Velocity: Anthony Recker, 78.8 mph
Base Running
Quickest First Step (on steal): Billy Hamilton, -.18 sec
Quickest Acceleration: Billy Hamilton, 2.17 ft/sec2
Greatest Max Speed: Billy Hamilton, 21.2 mph
Pitching
Longest Extension: Edison Volquez, 84 in
Actual Velocity: Edison Volquez, 95.2 mph
Largest Difference between Perceived and Actual Velocity: Francisco Rodriguez, 2.9 mph
Greatest Spin Rate: JJ Hoover, 2582 rpm
These stats really don't mean much since they're only taken from a few plays, but imagine what we could come up with if we had every games' stats. Also, think about how we could correlate some of this data with other metrics. How does a pitchers Spin Rate effect his Fly Ball or Ground Ball rate? How does a players Lead Length or First Step affect his Stolen Base percentage? Does a batters average Exit Velocity or Launch Angle have any correlation with his BABIP or OPS? This could help players know what they need to work on. A batter will now know if he needs to work on his acceleration out of the box and pitcher will know if his extension is causing him to throw more balls.
All of these things will be dealt with as soon as we get more data. I am trying to increase my "First Step" rate by creating tables to house the new data before it is available. In a future post I will hopefully come up with a good way to demonstrate all of the fields in my PlayIndex tables so that others can provide feedback. By no means do I think I have hit the nail on the head with this first attempt to store the new data, but I at least wanted to get the ball rolling.
Subscribe to:
Posts (Atom)

