
By this point we have a decent idea as to what type of performance the team is receiving from the everyday starters and even some of the most-used replacements. I scraped play-by-play data as well as team statistics from the NCAA website in order to take a closer look as to what has gone wrong thus far and to see if there is anything that can be done to correct this trend.
A good starting point is to look at the team's runs scored and runs allowed. We can use these numbers to find the teams run differential. This metric is important because it a fairly solid predictor of a teams' win-loss record. The thought process is if a team scores lots of runs and allows very few runs they will win a majority of their games. As I am writing this - through the first eleven games - Wichita State has scored 78 runs and allowed 77 runs. Intuitively one would come to the conclusion that WSU should be a .500 team and that would be correct. Bill James - famed sabermetrician and a consultant to the Boston Red Sox - came up with a neat way of using a teams run scored and runs allowed to predict a teams winning percentage and the math is usually relatively accurate. His formula is very similar to the Pythagorean theorem and looks like this:
Winning percentage = Runs Scored ^ 2 / (Runs Scored ^ 2 + Runs Allowed ^ 2)
Squaring the variables provides a close estimate for Major League Baseball but to get a more accurate figure the exponent needs to be calculated for the college run environment. I will spare you the gory math and just say that I did this using the the NCAA play-by-play data and came up with an exponent of 1.8. Using this exponent in Bill James' formula I came up with a predicted win total - for WSU - of 5 to 6 games for this season through 11 games.
There is an easy explanation for why WSU has under-performed their Pythagorean estimate. The run differential of games they won is much higher than the ones they lost. Their four wins came by an average margin of 7.25 runs. Of the games they lost the average run differential was 3.5. So what does this mean? Basically this means that WSU can score runs, but they also allow a ton of runs. They need to find a way to keep games closer. The 3.5 run differential in their losses is not great, but it is better than last year. In 2015, the team had a 4.2 run differential in their losses. Much like this year, last year the team under-performed their predictive win total. They scored 342 runs and allowed 337 but came away with a 44% winning percentage when our formula had them pegged at 51%. This year they are on pace to score more runs than last year and last year they scored a lot. To put things in perspective, in the 2012 season the team had a record of 35-25 with an average runs per game of 5.4. Last year their runs per games stat was 5.7 - higher than there winning season in 2012 - and they had a losing record. This season they are scoring runs at a clip of 7.1 runs per game yet they continue to struggle to win.
Logically one might come to the conclusion that pitching is the culprit and that reasoning would be partially correct. There is no doubt that the pitching and defensive side of the game has failed WSU thus far, but is it the pitchers fault or has it been partly due to bad luck?
Take a look at the chart below showing the batting average on balls in play (BABIP) for this year and last year. The chart shows the stats for the pitchers who have the most batters faced this season and who we had stats for from last season.

* Sam Tewes was injured most of 2015 so 2014 stats were also used
For those of you unfamiliar with BABIP, it is a stat that gives us an idea as to how batters have performed against pitchers once they put the ball in play. In a sense, it is isolating only the batted balls. Every pitcher has an average BABIP that they hover around year in year out. If the pitcher has a higher than normal BABIP it could mean they are due for a regression and could start to see an increase in performance. Those experiencing a lower than normal BABIP could be candidates for a decline in performance as they are likely to see more balls in play go for hits against them.
By looking at the chart above we can see that the Shockers have seen an abnormal amount of balls in play go for hits. Is this because they are just giving up harder hit balls or are opponents simply finding holes.
To answer this question we need to look at batted ball metrics and I will use these same four pitchers as an example. Remember these players represent the majority of batters faced for the pitching staff. The next chart compares the batted ball data (ground ball %, fly ball %, and line drive %) from this season to last.
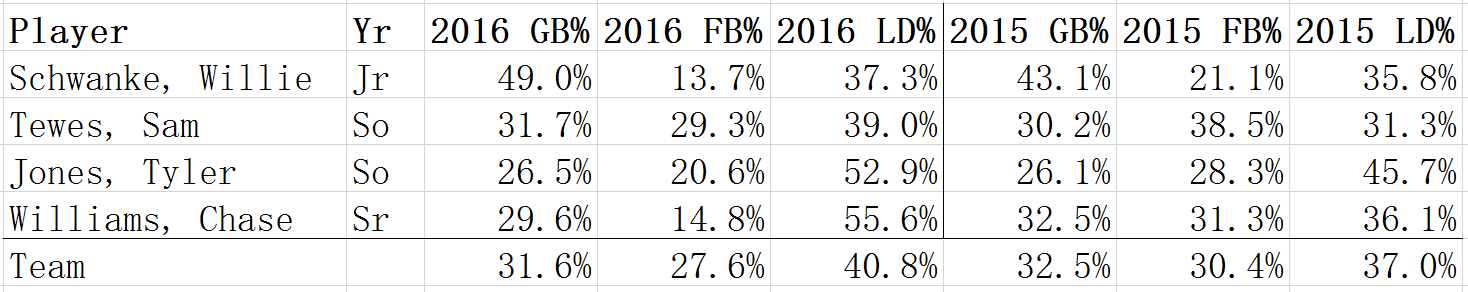
Not good all the way around. It would seem that the high BABIP's are in fact due to an increase in the number of hard hit balls - aka line drives. I will admit this batted ball data is not perfect, but I did pull the information from the NCAA website so I think it gives us reasonable estimate.
I want to take a look at one more stat to see if we can't more accurately pinpoint the problem. This final table shows you the left-on-base percentage (LOB%) for our four pitchers as well as the team from 2016 and 2015.

This could be the problem. Three of the four pitchers have seen a significant decrease in this percentage. This means that they are leaving less runners stranded on base. The hits are coming with runners on base and this spells problems for any pitcher. In the Shocker's case, three of their four most relied on pitchers are allowing poorly timed hits all at the same time of the season. It is no wonder why they are struggling. Can this be corrected? Most definitely! In fact, it has been researched and proven by many sabermetricians that LOB% regresses to the mean more often than not. For are four pitchers this means good times are coming. Let's just hope that when these times come the offense is still firing on all cylinders so that the increase in performance can translate into wins.


0 comments:
Post a Comment